
Journal
Field notes
Each entry expands one plate from The Science: what the chart shows, why it happens, and what the body requires in response.
Fig. 01 — Marker Decline by Decade
The curve is predictable — which is exactly why it can be answered
Testosterone, growth hormone, NAD⁺ and VO₂ max fall on timelines we can plot. Reading the chart is the first act of control.
August 2026
6 min read
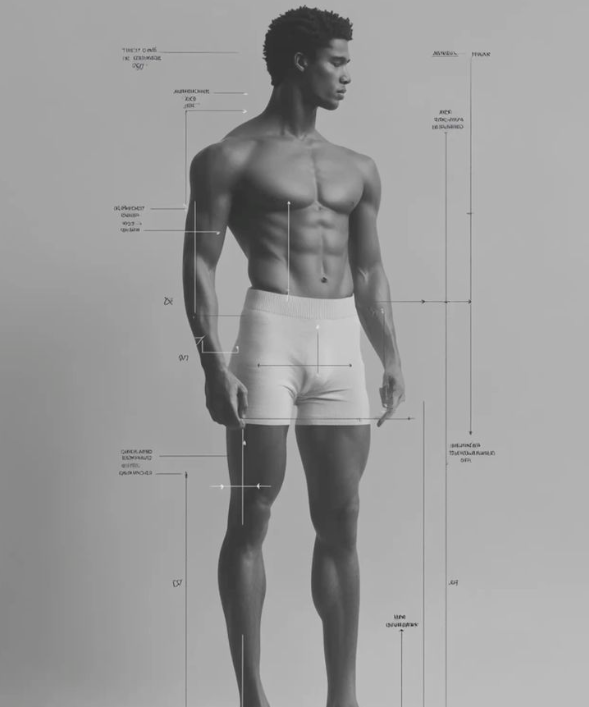
Fig. 02 — The Male System
One body, six systems: why men decline in pieces, not all at once
The neuroendocrine axis blunts before lean mass does. Connective tissue lags behind both. Treating the body as one dial is why protocols fail.
August 2026
7 min read

Fig. 03 — The Compound Effect
The compound effect: how one invisible input becomes a different physiology
Day one is unmeasurable. Week twelve is legible. Year one is a body that behaves differently. The mechanism is repetition, not intensity.
August 2026
5 min read